Used beverage filling machines
How the market has evolved between 2018 and 2025
From soft drink factories and mineral water bottling plants to craft beer production centres, beverage filling machines have long been at the heart of the industrial process. But what happens when these machines change hands? The second-hand market, often quiet and highly technical, holds key insights into the evolution of an entire industry.
by Isidro Gutiérrez, Marketing Executive MachinePoint
An exclusive analysis carried out by MachinePoint reveals the trends, shifts, and imbalances in this market between 2018 and 2025. The result is a portrait of a sector marked by the rise of emerging markets and the scarcity of certain types of technical equipment.
Strong demand pressure in a market with limited supply
The used beverage filling machinery sector shows clear signs of recovery in 2024. Demand has surged by 32% over the past year. At the same time, supply has also grown, reaching its highest level in the past eight years. This 21% increase compared to 2023 suggests that more companies are willing to renew assets and release machinery into the secondary market. Despite these positive indicators, a clear imbalance remains: demand for used filling machines continues to far outstrip supply. This gap represents both a challenge and an opportunity, especially for suppliers who can anticipate market needs. Although data for 2025 is still incomplete, the signals point to cautious optimism. If the trend continues, the market could enter a new cycle of sustained expansion.
The used filling machine market is dominated by complete PET and carbonated lines
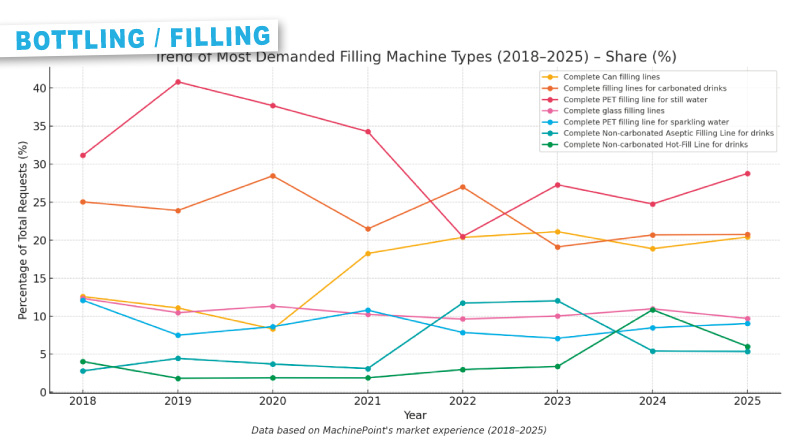
Between 2018 and 2025, global demand for used beverage filling machines has focused on a small group of technologies, mainly complete bottling lines for various types of drinks. According to the data analysed, the most in-demand machine type has been the complete PET line for still water, accounting for 24.5% of all requests registered in the period.
Second place goes to complete lines for carbonated drinks, with 18.6% of total demand, followed by complete canning lines at 12.1%. In recent years, especially since 2021, we’ve observed a significant increase in demand for can filling lines. This format has seen a strong resurgence, driven by its recyclability, modern aesthetics, and popularity in categories such as craft beers, energy drinks, and flavoured waters. Companies are increasingly investing in canning lines to diversify their offering and respond to evolving consumer preferences.
Complete glass bottle lines rank fourth at 8.3%, while PET lines for sparkling water represent 6.9% of all requests. Glass bottling lines, traditionally associated with premium products such as wine, spirits, or high-end mineral waters, have maintained a steady presence, although their relative weight has clearly declined. While glass remains appreciated for its look and reusability, logistical challenges, cost, and fragility have led many companies to prioritise more practical alternatives. Another notable shift is the growing demand for more specialised technologies, such as aseptic lines for still drinks and hot-fill lines. These solutions once largely limited to large producers or specific products are gaining traction thanks to the expansion of categories such as preservative-free juices, functional beverages, infusions, and bottled teas.
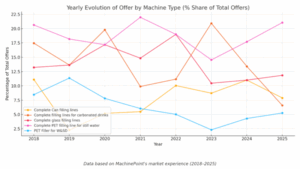
On the supply side, similar patterns emerge with slight variations
Complete PET lines for still water also lead the supply side, accounting for 18.6% of all machines offered, followed by lines for carbonated drinks (14.7%) and glass lines (14.0%). Complete canning lines drop to fourth place with 8.0%, while in fifth place we find a more technical type: PET fillers for still water and beverages, representing 6.2% of total supply.This analysis confirms that the market is strongly oriented towards complete lines rather than individual components. It also reveals a reasonable degree of balance between what is sought and what is available on the second-hand market. However, specific mismatches persist, for example, lower availability of can lines despite high demand, presenting clear opportunities for brokers and resellers. Overall, the picture suggests that machinery for bottled PET drinks and carbonated beverages will continue to drive the second-hand filler market in the coming years.
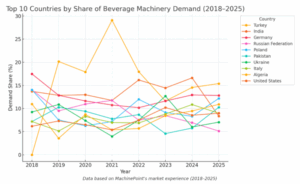
Turkey leads global demand for used beverage filling machines, while Germany and Italy dominate supply
A global market analysis of used beverage filling machines between 2018 and 2025 highlights Turkey’s leading position, accounting for 14.2% of all requests during this period. This dominance is partly due to intense demand in 2019 and 2021. Despite a downward trend since 2022, no other country has matched Turkey’s cumulative share.
India ranks second with 11.7% of total requests, showing more consistent growth and a slight rebound in 2024. Close behind are Germany (7.8%), the United States (7.4%), and Algeria (6.5%), which while not leading in volume have maintained solid demand over the years.
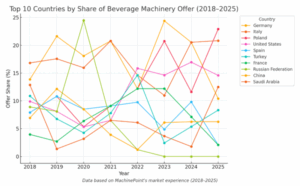
On the supply side, Europe clearly dominates. Germany accounts for 18.2% of all used filling machinery offered on the global market, followed by Italy (16.4%) and Poland (12.1%). The quality, reliability, and longevity of equipment manufactured in these countries explain their leadership in the second-hand segment.
The United States also stands out, contributing 8.6% of global supply, consolidating its position as a growing exporter in recent years. France (5.2%) and Russia (4.8%) complete the top six, although Russia’s participation has drastically declined since the outbreak of the war in Ukraine in 2022, virtually disappearing from the international market.